A red run tells you a test failed. It rarely tells you why. A screenshot of the final state helps, but the interesting moment usually happened a few actions earlier: a click that missed, an API call that returned the wrong shape, a page that never finished loading. That earlier moment is exactly what a Playwright trace preserves.
This guide walks through what a trace captures, how to read one against a real failure, and when the trace won't be there.
What a trace records
A trace is a detailed recording of a single test run. It can include the action log, DOM snapshots, console events, network requests, timing, screenshots, and attachments. Where a screenshot is one frame and a video is the motion, a trace is the browser's flight recorder: it lets you scrub to any action and inspect the exact page state, network, and console around it.
That combination is what makes traces the right tool when the visible evidence shows what happened but not why. If the screenshot already explains the failure (wrong page, an obvious validation error) you probably don't need the trace at all. Reach for it when the surface-level evidence runs out.
Where traces live
Trace availability depends on the run configuration. Storing a full trace for every passed test gets expensive, so many teams keep traces only for failures, enough to debug a regression without paying to archive thousands of green runs.
To open one:
- Open Runs and select a completed or failed run.
- Open the Features tab.
- Open the scenario row you want to inspect.
- For a failed scenario, choose Debug with AI. For a passed or skipped scenario, choose Open Playwright trace.
Both actions open the same Playwright trace viewer. If a scenario has no trace, the Open Playwright trace action simply isn't shown for that row.
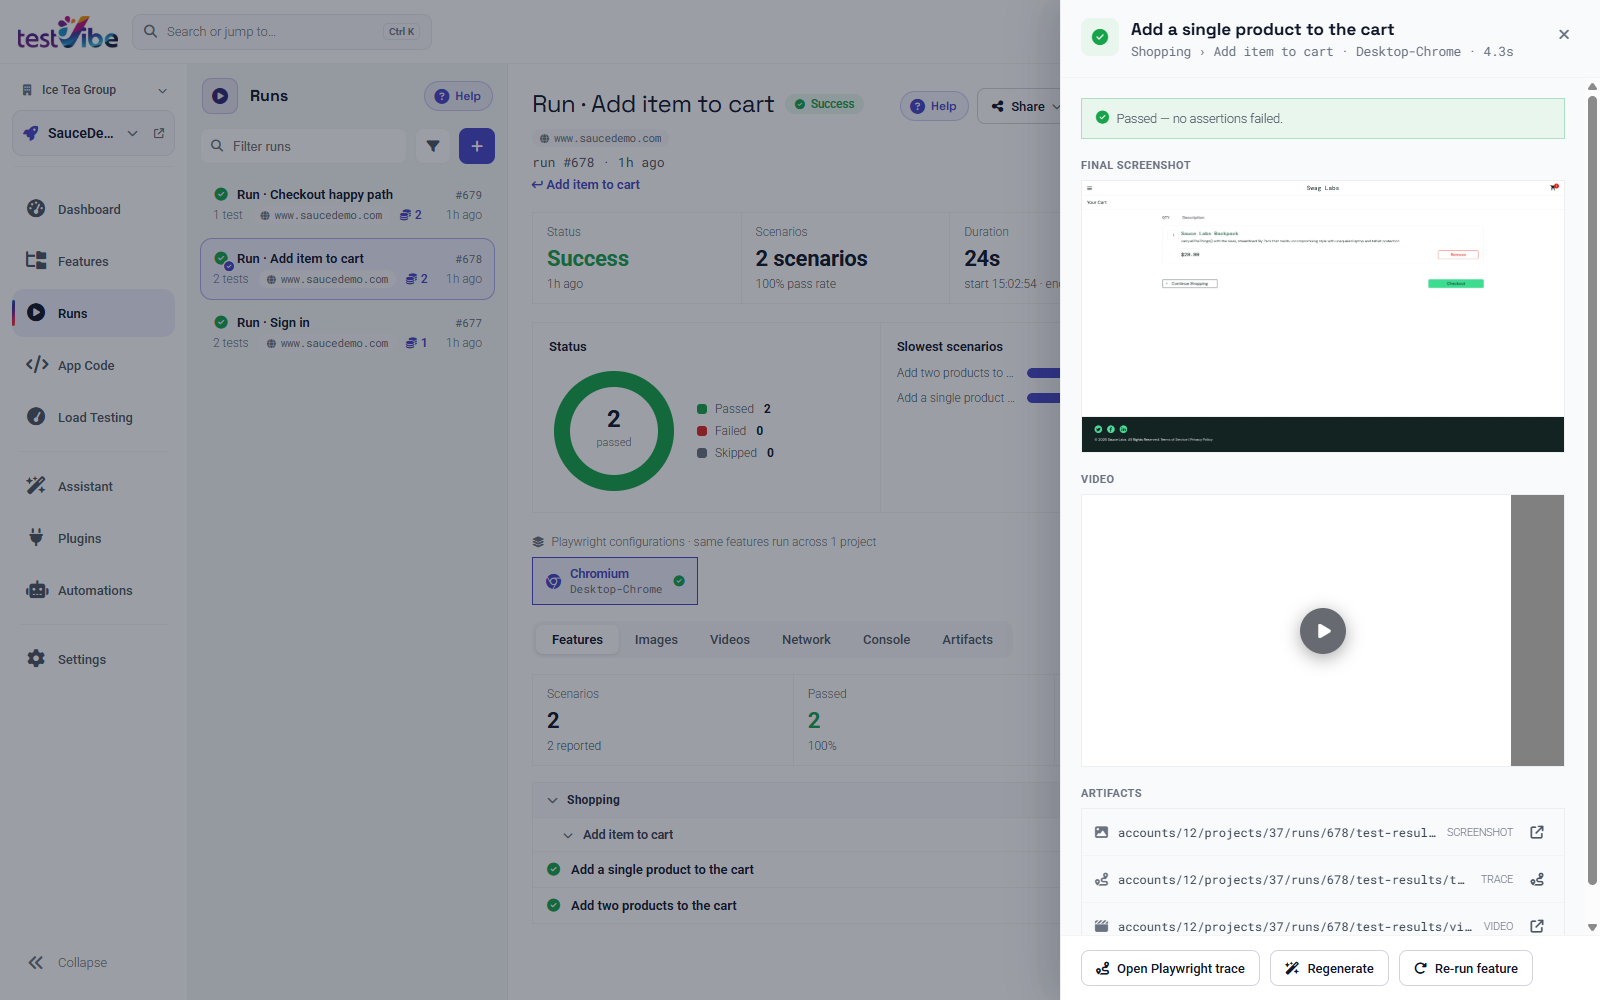
You can also grab the raw trace file from the Artifacts tab, where every uploaded file is grouped by the scenario that produced it. Download it when a teammate needs the .zip or you want to keep a copy outside TestVibe.
Walking a real failure
Consider an illustrative checkout failure, rather than a captured incident. The failed row shows the error text and a final screenshot of the cart page, but the cart looks fine, which is the confusing part. Time to open the trace.
Start in the Actions list on the left. It's the ordered log of every Playwright call the test made:
✓ page.goto('https://example.test/cart')
✓ expect(page.getByText('Sauce Labs Backpack')).toBeVisible()
✓ page.getByRole('button', { name: 'Checkout' }).click()
✗ page.getByRole('button', { name: 'Continue' }).click()  ← timeout
The failure is the Continue click, not the cart assertions before it. Select that failing action and the viewer pins the snapshot to the moment it ran. This is the key move: you're now looking at the DOM as Playwright saw it, not the final screenshot taken seconds later.
The snapshot shows the checkout form, but the first-name field carries an inline error, and the Continue button is disabled until required fields are completed. Now the timeout makes sense: the button existed but wasn't actionable when the click fired.
Cross-check with the other panels to confirm the story:
| Panel | What it tells you here |
|---|---|
| Timeline | The Continue action ran, then burned its full timeout retrying: a classic "element present but not clickable" signature. |
| Console | A client-side validation warning fired the instant the form rendered. |
| Network | The form's submit request never went out, so this is a front-end block, not a failed API call. |
The verdict: the app rendered a validation state the test didn't expect, and the action log confirms that the button was disabled during the wait. That's a real product behavior worth a bug report, or, if the validation is correct, the test needs to fill the field first. Either way, that's a conclusion reached from evidence, not a guess.
The panels, and what each one answers
Each area of the trace answers a different question. Knowing which panel to open saves you scrubbing through all of them.
| Trace area | Use it for |
|---|---|
| Actions | Every click, fill, navigation, and assertion, in order. Find the exact step that failed. |
| Snapshots | Inspect the page DOM around each action, not just the final frame. |
| Timeline | Spot slow actions, timeouts, and late-loading resources. |
| Console | Match a browser error to a specific moment in the test. |
| Network | See requests and responses near the failing action. |
| Attachments | Review screenshots and other files tied to the run. |
A reliable reading order for a timeout or "element not found" failure: Actions to locate the failing step, Snapshots to see the page at that instant, then Console and Network to decide whether the cause is the UI, the app's own JavaScript, or a backend call.
The Debug with AI shortcut
Choosing Debug with AI on a failed scenario opens the same trace viewer, but docks an AI assistant beside it. The assistant reads the trace and starts diagnosing the failure automatically, pointing at the failing action, the relevant console error, or the suspicious network response, so you're not scrolling from a cold start.
Treat it as a fast first pass, not a verdict. It's good at surfacing the likely culprit action and the surrounding signal; you still confirm against the snapshot and decide whether the fix belongs in the app or the test. On a big run with several unrelated failures, that head start is the difference between triaging in minutes and triaging in an afternoon.
When the trace isn't there
Traces are captured by the run configuration, so a few situations leave you without one:
- Capture is disabled, or traces are retained only on failure. A passed test may not have kept one. Review the selected configuration.
- The run failed before Playwright launched. A setup, dependency, or secret problem. There's nothing to trace yet; fix the setup first.
- The run is still finalizing. Artifacts are still uploading. Wait and refresh.
- Artifacts expired or were deleted. Re-run the test to capture fresh evidence.
If no trace is available, fall back to the failed row's error text, the final screenshot, and the console and network evidence to narrow the cause.
Wrapping up
Traces turn "it failed" into "here's the exact action, DOM, console, and network state where it broke." Start with the Actions log, pin the failing step's snapshot, and confirm with console and network before you decide whether the app or the test is wrong. Because TestVibe verifies generated tests by actually running them, each failure records a test outcome to investigate; it may originate in the app, test or environment, and Debug with AI gives you a running start on it. Get early access to try it, or read more in the trace docs.