A passing test suite tells you the paths you tested still work. It says nothing about the server underneath them — whether memory is creeping up run over run, whether an unhandled exception is quietly firing in production, whether the box is near its CPU ceiling. TestVibe telemetry closes that gap: install a small agent in the application you test, and its server-side vitals and errors show up in the same place as your test results.
What telemetry shows you
Once the agent is running, telemetry lands in two surfaces.
Dashboard → Live Servers is a real-time view. Each server reporting into your project renders as a card with live charts for CPU, memory, active sessions, memory per session, thread count, and managed GC heap. The .NET agent streams for watched dashboards or active runs; current production also persists 60-second vitals rollups for history — open it while a load test runs and watch the server react as virtual users replay your features.
Load test results embed the same server vitals next to the client-side latency charts. Client numbers tell you what users experienced; server telemetry supplies evidence for possible causes. Rising p95 with CPU saturation merits investigation; inefficient code can itself cause a capacity bottleneck.
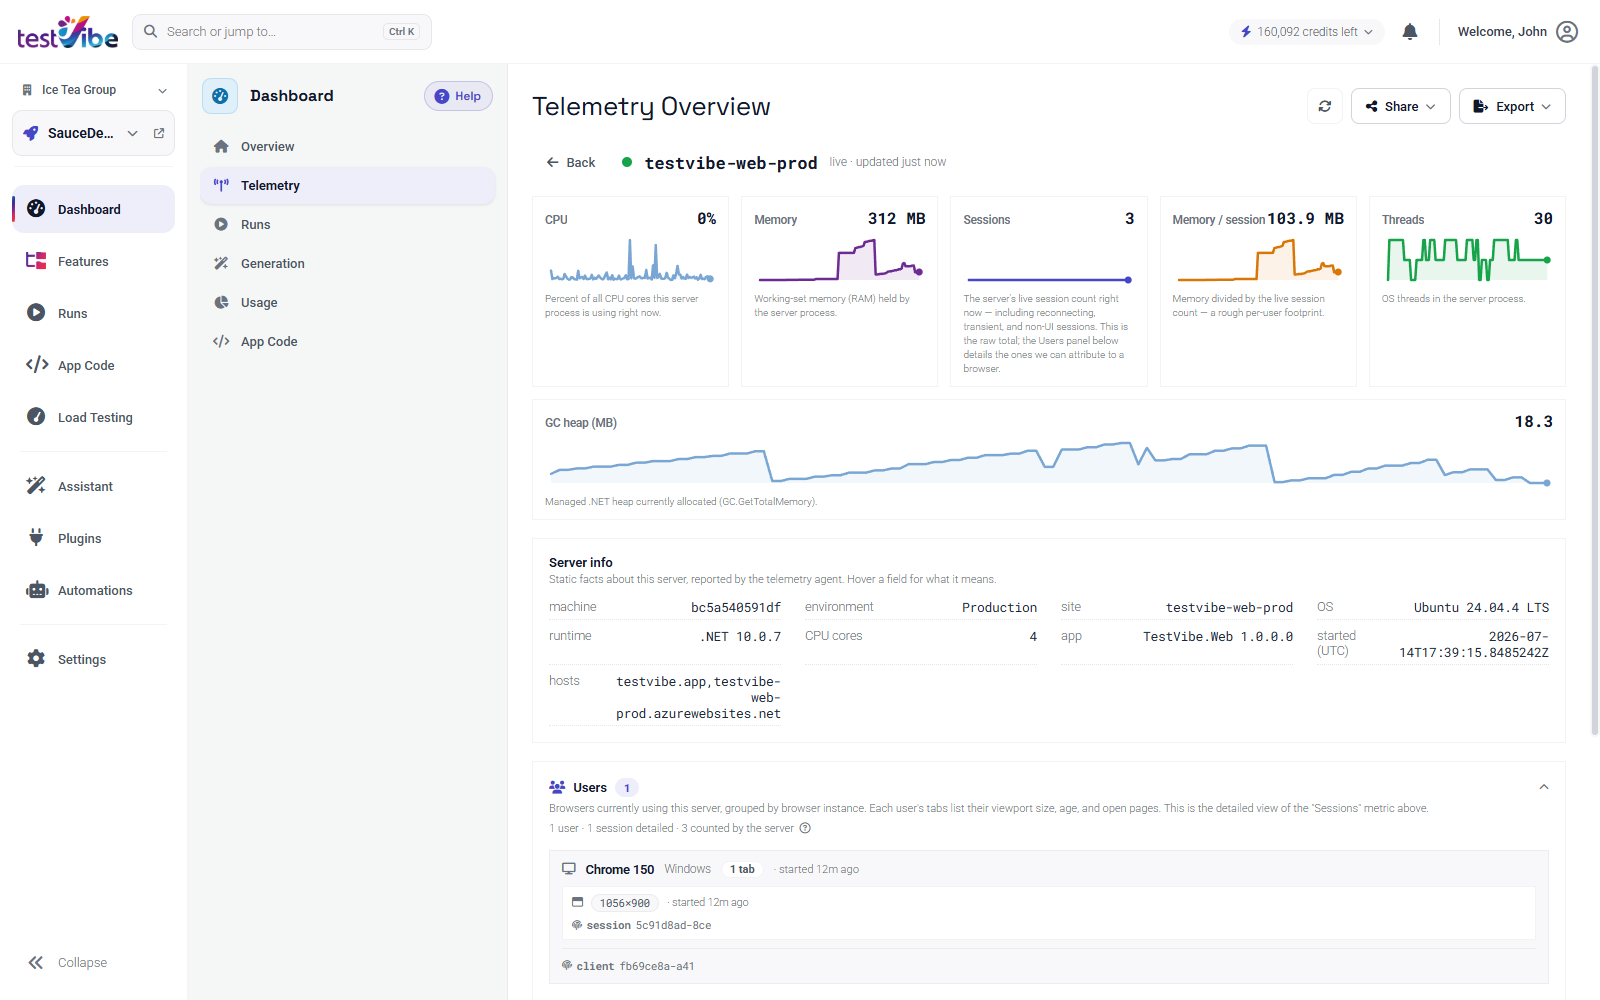
The overview also carries a Server info card — runtime, OS, CPU cores, environment, host names, process start time — and an optional Users breakdown when the host supplies the session callback; it is not automatically available for every framework.
Wire up the agent
You need one thing to start: a workspace-scoped API key (tvb_…) from Settings → CLI & API keys. The agent discovers your projects from the key, so on .NET you don't even pass a project id.
For .NET, install the TestVibe.Telemetry package. The source targets netstandard2.0 and net8.0. Check package dependencies and your runtime; Microsoft recommends .NET Framework 4.7.2 or later for consuming .NET Standard 2.0 libraries.
dotnet add package TestVibe.TelemetryRegister it once at startup. The optional SessionCount callback is what unlocks the Sessions and Memory / session metrics — wire it to whatever represents an active session in your app (SignalR connections, signed-in users, a framework's built-in counter).
// Program.cs
using TestVibe;

var builder = WebApplication.CreateBuilder(args);
var app = builder.Build();

Telemetry.Register(
    builder.Configuration["TestVibe:Server"] ?? "https://testvibe.app",
    builder.Configuration["TestVibe:ApiKey"], // tvb_… from Settings → CLI & API keys
    new TelemetryOptions
    {
        SessionCount = () => MyConnectionCounter.Current,
    });

app.Run();
Node services can use the dependency-free single-file agent with Node.js 18 or later. Copy testvibe-load-agent.js from Settings → Telemetry — it has no dependencies — and start it once at boot:
const { startTestVibeLoadAgent } = require('./testvibe-load-agent');

startTestVibeLoadAgent({
  server: 'https://testvibe.app',
  apiKey: 'tvb_…',                  // Settings → CLI & API keys
  project: '<your-project-id>',
  sessions: () => myActiveSessions, // optional
});
The .NET agent samples for active runs or watched dashboards. The Node single-file agent samples during active load runs. Both still poll while idle and report errors independently; delivery is bounded and best-effort, with some runtime overhead.
Custom metrics, info, and errors
Beyond the built-in vitals, the agent gives you three calls you can make from anywhere in your code.
// Gauges — charted alongside CPU/memory (latest value wins, subject to the agent’s current limits).
TestVibe.Telemetry.ReportMetric("Orders/min", ordersPerMinute);

// Static facts shown in the server card header.
TestVibe.Telemetry.ReportInfo("Region", "westeurope");

// Errors — grouped and persisted under Dashboard → Telemetry → Errors & exceptions.
try { DoWork(); }
catch (Exception ex) { TestVibe.Telemetry.ReportError(ex); throw; }
Unhandled exceptions are captured automatically; ReportError lets you add the handled ones you'd otherwise never see. Errors are grouped and persisted; current production also stores vitals rollups, so you can review what fired during a run long after the run finished.
Reading the signal
A few patterns are worth training your eye on:
- CPU drifting toward saturation while latency p95 rises is the classic capacity ceiling. Scale or optimize before you loosen a threshold.
- Memory that climbs run over run without recovering points at a leak the load is exposing. Memory / session isolates whether the growth is per-session or global.
- Sessions reports the host callback’s definition of active sessions; compare it with VUs rather than assuming they are equal — a suspiciously low count usually means your virtual users aren't establishing real sessions.
From a telemetry signal to a covering test
Telemetry is most useful when it feeds back into your suite. Say the Errors & exceptions panel surfaces a NullReferenceException on checkout that only appears under concurrency — a path none of your current tests exercise. That's the moment to write a test for it.
In TestVibe you don't hand-write the Playwright. Create a feature and describe the flow in plain language, keyed off the visible labels involved:
Feature: Checkout with an empty saved address

  Background:
    Given I am on the "Sign in" page
    When I sign in as a customer with no saved address
    And I add "Sauce Labs Backpack" to the cart

  Scenario: Placing an order when no address is on file
    When I open the cart and click "Checkout"
    And I click "Continue" without selecting an address
    Then an "Add a shipping address" message should appear
    And the order should not be submitted
TestVibe generates the Playwright test from that description and runs it in a cloud sandbox to confirm it actually reproduces — a generated test that hasn't been executed is just a guess, so verification is part of generation. Now the crash you saw in telemetry has a test that fails until it's fixed and becomes a regression check that should pass after the fix and fail if the bug returns. Telemetry found the gap; the test closes it.
Where telemetry lives
Persisted telemetry — the errors and exception history — counts against your workspace's shared storage quota, alongside runs, load results, and generated tests. You can set how long TestVibe keeps each data type in Settings → Storage, where a per-type retention policy evicts the oldest entries first as you approach the quota. Persisted vitals rollups also count toward the telemetry storage domain and follow retention settings.
Wiring up the agent takes one package and one line at startup, and it turns your test suite from a snapshot into a continuous read on the app behind it. See the Server telemetry docs for every framework snippet, or get early access to try it against your own app.