A test run produces more than a green or red badge. It produces a hierarchy: one run status on top, a set of scenario rows underneath, and — attached to each scenario — the screenshots, video, trace, and logs that explain what the browser actually did. Once you know how that structure is laid out, triage stops being a hunt through files and becomes a top-down read.
Two levels of status
TestVibe reports status at two levels, and reading them in order is the whole trick.
- The run status describes the entire run: passed, failed, cancelled, or still active.
- The row status describes one scenario (one test) inside that run.
A run can be marked failed even when most of its scenarios passed. That is the point of separating the two levels — the run status is a signal that at least one scenario or setup step needs attention, and the rows tell you which. Start at the top, then drill down.
| State | Meaning |
|---|---|
| Passed | The run or scenario completed successfully. |
| Failed | At least one scenario failed, or the run could not complete. |
| Cancelled | The run was stopped before it finished. |
| Skipped | A scenario was intentionally not executed. |
| Queued or in progress | Still active; the final result is not ready. |
| Unavailable | Not enough result data to show the row or artifact yet. |
The run detail at a glance
Open Runs and select a run. The run detail view pulls status, rows, charts, and evidence into one place so you rarely have to leave it.
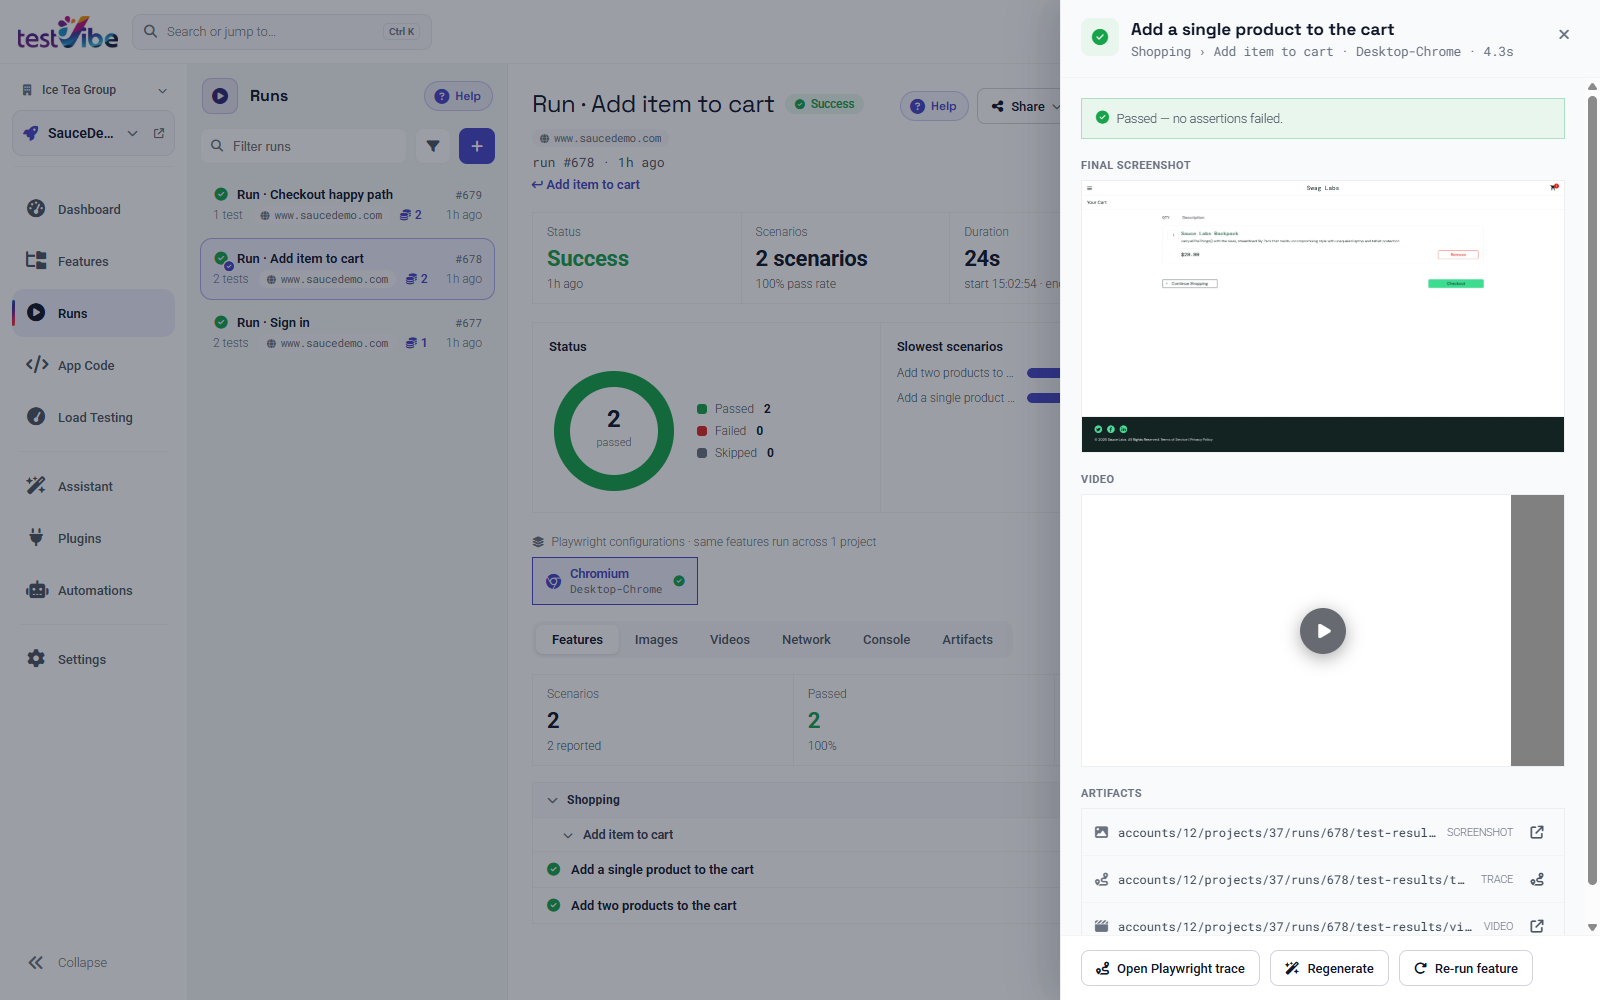
The top of the view is oriented around summary tiles and charts:
| Area | What it tells you |
|---|---|
| Summary tiles | Overall status, duration, selected files, and pass/fail counts. |
| Charts | Patterns across status, groups, duration, and the slowest scenarios. |
| Features tab | Individual scenario rows, grouped, with failed rows called out. |
| Images / Videos tabs | Browser evidence captured during the run. |
| Artifacts tab | Every file the run uploaded, each downloadable. |
Scenarios, groups, and per-configuration rows
The Features tab is the body of the report. Scenario rows are nested under the feature group they belong to — a sign-in group, a checkout group — so a cluster of failures in one area reads as a cluster instead of a scattered list.
One detail trips people up the first time: the row count is not always the same as the scenario count. If you selected more than one Run Configuration in the composer, each scenario runs once per configuration, and each run produces its own row. The math is scenarios × configurations. Run two scenarios across a desktop-Chromium config and a mobile-WebKit config and you get four rows, not two. That is what makes "only the mobile configuration fails" a legible signal — the same scenario passed on desktop and failed on mobile, side by side.
Rows also fill in progressively. At the very start of a run, TestVibe may show only the selected feature files; the detailed executable rows appear after the cloud test session builds the execution plan, then update live as Playwright reports each result.
Artifacts are attached to the scenario that produced them
This is where the structure pays off. Available scenario evidence is grouped by the scenario that produced it, so you don't have to match cryptic filenames by hand. Open a scenario row and its evidence is right there, in the order you want to read it:
| Layer | What it shows |
|---|---|
| Error | The Playwright error text, assertion output, and failure source. |
| Location | The spec file and configuration where the failure occurred. |
| Final screenshot | The browser state at the end of the scenario. |
| Video | The browser session leading up to the result. |
| Trace | The action-by-action Playwright recording. |
Read it top to bottom. The error usually names the problem; the location tells you which spec and which configuration; the screenshot confirms whether the browser was even on the right page. When a screenshot shows the expected page but the assertion still failed, compare expected and actual behavior; the app may be broken or the expectation may need a deliberate update, and a screenshot alone may not distinguish them.
For a failed row, Debug with AI opens an available trace and docks an assistant that suggests a diagnosis. For a passed or skipped row, the same evidence opens through Open Playwright trace. If a scenario has no trace, that action simply isn't shown.
Logs, console, and network
When the screenshot and video show what happened but not why, the trace carries the deeper layers. Inside the Playwright trace viewer you can walk each action, inspect the DOM snapshot around it, read console errors matched to the exact moment they fired, and see the network requests and responses near the failing step. The run detail surfaces Console and Network as their own tabs too, so you can scan browser errors for the whole run without opening a single trace.
Trace availability depends on the run configuration — many teams keep traces only for failed tests to avoid storing large artifacts for every pass. If a trace is missing, check configuration, upload status, retention and permissions before deciding why. The same is true for screenshots and video: a configuration that saves evidence only on failure won't leave artifacts on passing rows.
A read that scales
The structure rewards a fixed reading order: confirm the run status, find the failed rows in Features, open the row, check the screenshot, and open the trace only when the screenshot isn't enough. Because artifacts already sit under their scenario, each step is one click deeper rather than a filename search. When you need to hand a failure to a teammate, every run has its own deep link, and the Download menu exports the whole run — scenarios, statuses, and artifact links — as JSON, CSV, Excel, PDF, or PNG.
Want to see a run detail with your own app's evidence attached to each scenario? Get early access, or read the full Review Results guide.