A red run is a question, not a verdict. The useful skill is turning that red into a short list of decisions and closing them fast. This guide walks the loop TestVibe is built for: read the run, isolate the real failures, re-run only those, and pick the right fix for each one.
Read the run before you read the tests
TestVibe reports status at two levels: the run status describes the whole run, and each test row status describes one scenario. Start at the top and work down. Open the run, note whether it Passed or Failed, then open the Features tab to see which rows produced that outcome.
A failed run does not mean everything is broken. A run can fail even when most tests pass — a single failing row flips the whole run to Failed. Treat that as a signal that at least one selected test or setup step needs attention, not as a reason to distrust the green rows.
The shape of the failures tells you where to look first:
| Pattern | What it usually means |
|---|---|
| One failed row | Start with that test's details and evidence. |
| Several failures in one group | Check the shared flow or data for that feature area. |
| Many rows fail at the same step | Check login, environment state, or a common prerequisite. |
| Only one browser or configuration fails | Review viewport or configuration-specific behavior. |
That last column is the whole point of reading the run first: five failures at login suggest a shared prerequisite worth investigating first. Fix the prerequisite before you touch any individual test.
Open one failed row and let the evidence talk
Pick a representative failed row and expand it. The failure panel is meant to be read top to bottom, and each layer answers a different question:
| Area | What to look for |
|---|---|
| Error | The Playwright error text, assertion output, and failure source. |
| Location | The spec file and configuration where the failure occurred. |
| Final screenshot | The browser state at the end of the failed scenario. |
| Video | The session leading up to the failure. |
| Debug with AI | Opens the full Playwright trace with an assistant docked beside it that suggests a diagnosis to check. |
Start with the screenshot when one was retained, then compare other evidence. If the shot shows the wrong page, you have a navigation, login, or environment problem. If it shows the expected page but the assertion still failed, compare the intended behavior with actual state; the app may have regressed or the expectation may need a deliberate update. When the panel does not explain it, open the trace: the action-by-action timeline, DOM snapshots, console errors, and network requests are where "the app was just slow" separates from "the selector no longer exists."
The read here maps cleanly onto a decision:
| Signal | Likely cause | Fix |
|---|---|---|
| Screenshot shows the wrong page | Navigation, login, or environment setup | Fix the environment or credentials, then re-run |
| Expected page, assertion failed | App regression or stale expectation | Confirm intended behavior before fixing app or test |
| Missing selector or timeout | The UI changed, or the app was slow | Regenerate if the UI moved; re-run if it was flaky |
| Error before the test reaches the app | Session setup, dependencies, or secrets | Fix setup, then re-run |
Re-run just the failures
Once you know which rows are worth retrying, you do not re-run the whole suite. From Runs, select the failed run and choose Re-run. The run composer opens pre-scoped to that run — the same tests are pre-checked and the same Playwright configurations are pre-selected — and from there you narrow to only the failed tests.
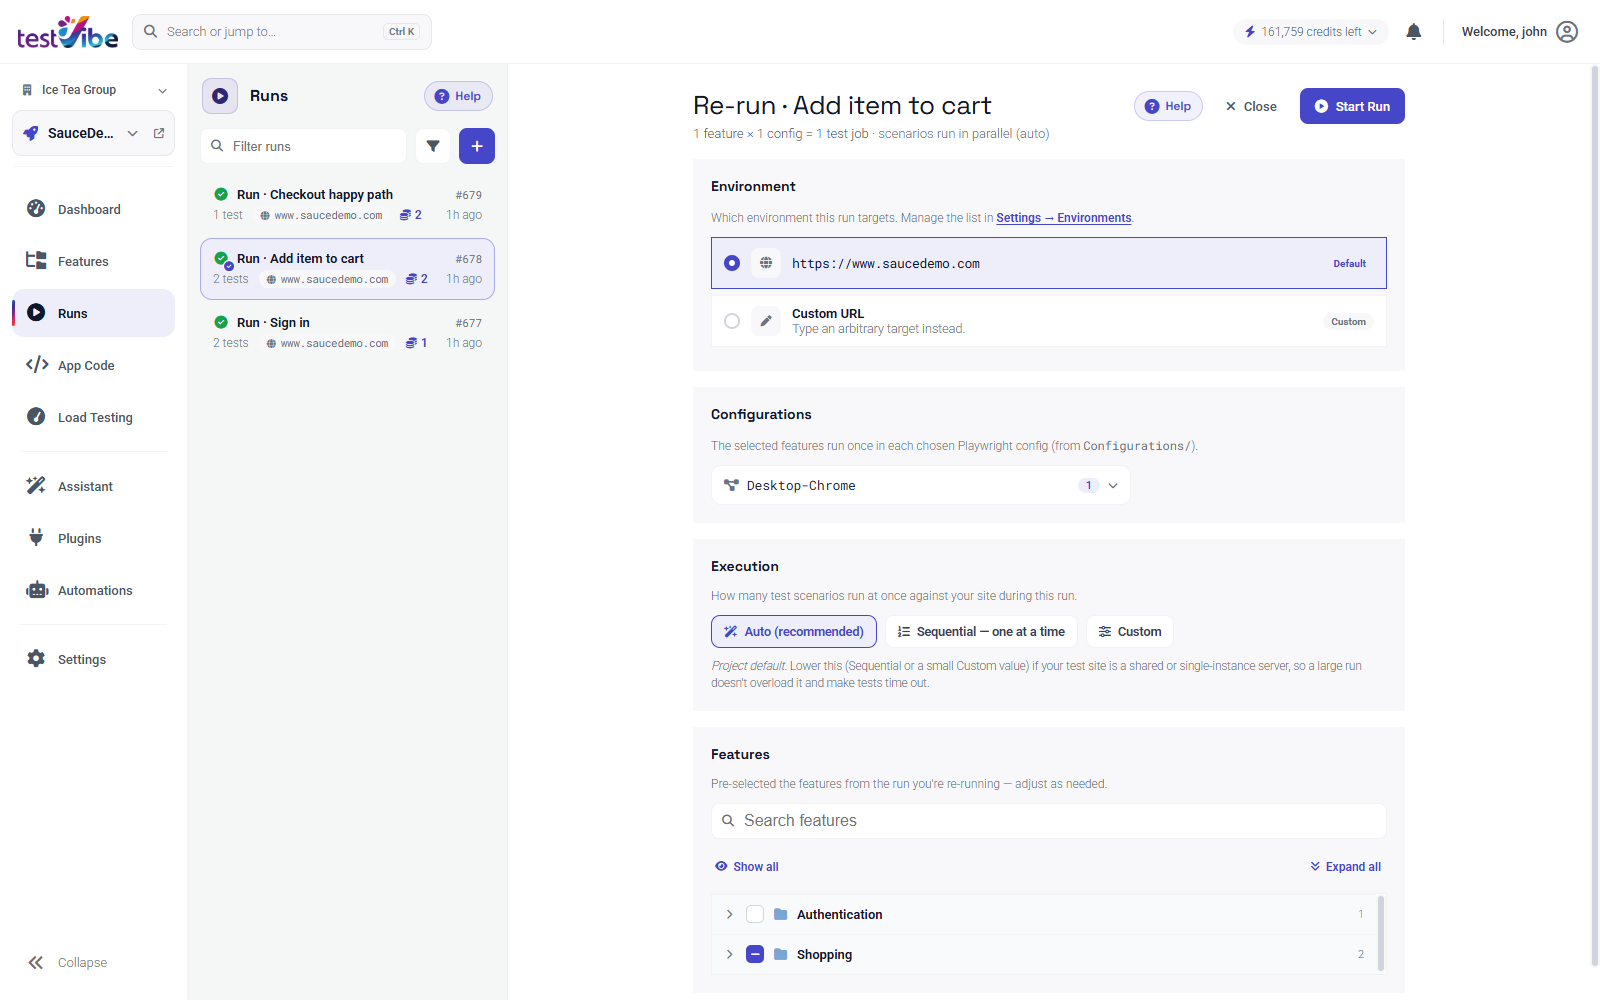
Choosing Re-run does not start anything on its own. The new run is only dispatched when you choose Start Run, so it is safe to open the composer just to review what a run covered and trim the selection. Uncheck the groups that passed, keep the rows that failed, and start.
Here is what carries forward, and what to double-check before starting:
| Item | Pre-filled from | Check |
|---|---|---|
| Test selection | The run's tests, pre-checked | Narrow to just the failed rows |
| Site URL | The previous run's target, reused | To hit a different environment, use New Run instead |
| Configuration | The run's Playwright configs | Confirm browser and viewport |
| Secrets | Read from Settings → Variables & Secrets at run time | Refresh credentials if the failure was auth-related |
Two details matter for scoped re-runs. First, a re-run creates a new attempt; the original run stays in history, so you can compare before and after directly rather than losing the evidence you just read. Second, if the original failure looked like an overloaded test site — timeouts under parallel load rather than real bugs — set Execution to Sequential or a small Custom cap so the retry does not reproduce the same contention.
Re-run, regenerate, or fix the app
Every triaged failure lands in one of three buckets. Naming the bucket is the decision.
Re-run when the failure was not about the test being wrong: a flaky timeout, a slow-loading resource, a service that was briefly down, or credentials you have since refreshed. Nothing to change — retry the same test and see if it holds.
Regenerate when the test itself is out of date. Confirm the product’s intended behavior first. An assertion failure on the expected page does not by itself justify changing the test. If the contract deliberately changed, update the scenario and review regenerated code. Because a feature is described in natural language and the Playwright code is generated from it, regenerating updates the expectations to the current app — and the new code is verified by actually running it before you trust the result.
Fix the app when the test is right and the app is wrong. The screenshot shows a broken page, a 500, a missing element that should be there — that is a bug your suite just caught. Fix the application, then re-run the failed scope to confirm the red turns green.
The loop is deliberately small: read the run, open one row, scope a re-run to the failures, pick a bucket. A morning of scrolling logs becomes a few minutes of targeted decisions. Get early access to run it against your own app, or read Inspect failed steps for the full triage reference.