A passing functional test shows that its checked journey worked on that run. They say nothing about what happens when a few dozen people run that journey at the same time. TestVibe closes that gap with built-in load testing: the same journeys you already generated as Playwright tests can be replayed by concurrent browser users, or you can point protocol-level k6 traffic at your endpoints within the same workspace.
This is a practical walkthrough: what TestVibe load tests are, how to configure one, how to run it, and how to read the results.
What a TestVibe load test is
Load Testing lives in its own section of the navigation rail, separate from functional Runs. Under the hood, load tests share the same run infrastructure as your functional tests — the same dispatch, the same cloud fleet, the same live-updating results — but the workload is different. A load test runs in one of two modes:
- Simple — concurrent browser users replay your generated feature tests and time every step. No k6 script involved. This exercises browser-level behavior: real browsers, real UI-level load, per-step latency.
- Advanced — protocol-level k6 load with a configurable profile (paths, virtual users, ramp, duration, think time) and pass/fail threshold gates. TestVibe generates the k6 script for you, and you can review it before anything runs.
The relationship to functional runs is simple: a journey needs a generated test before it can be used in a Simple load test. If you haven't generated tests yet, Advanced mode still lets you drive URL-based load at your endpoints.
Configuring a load test
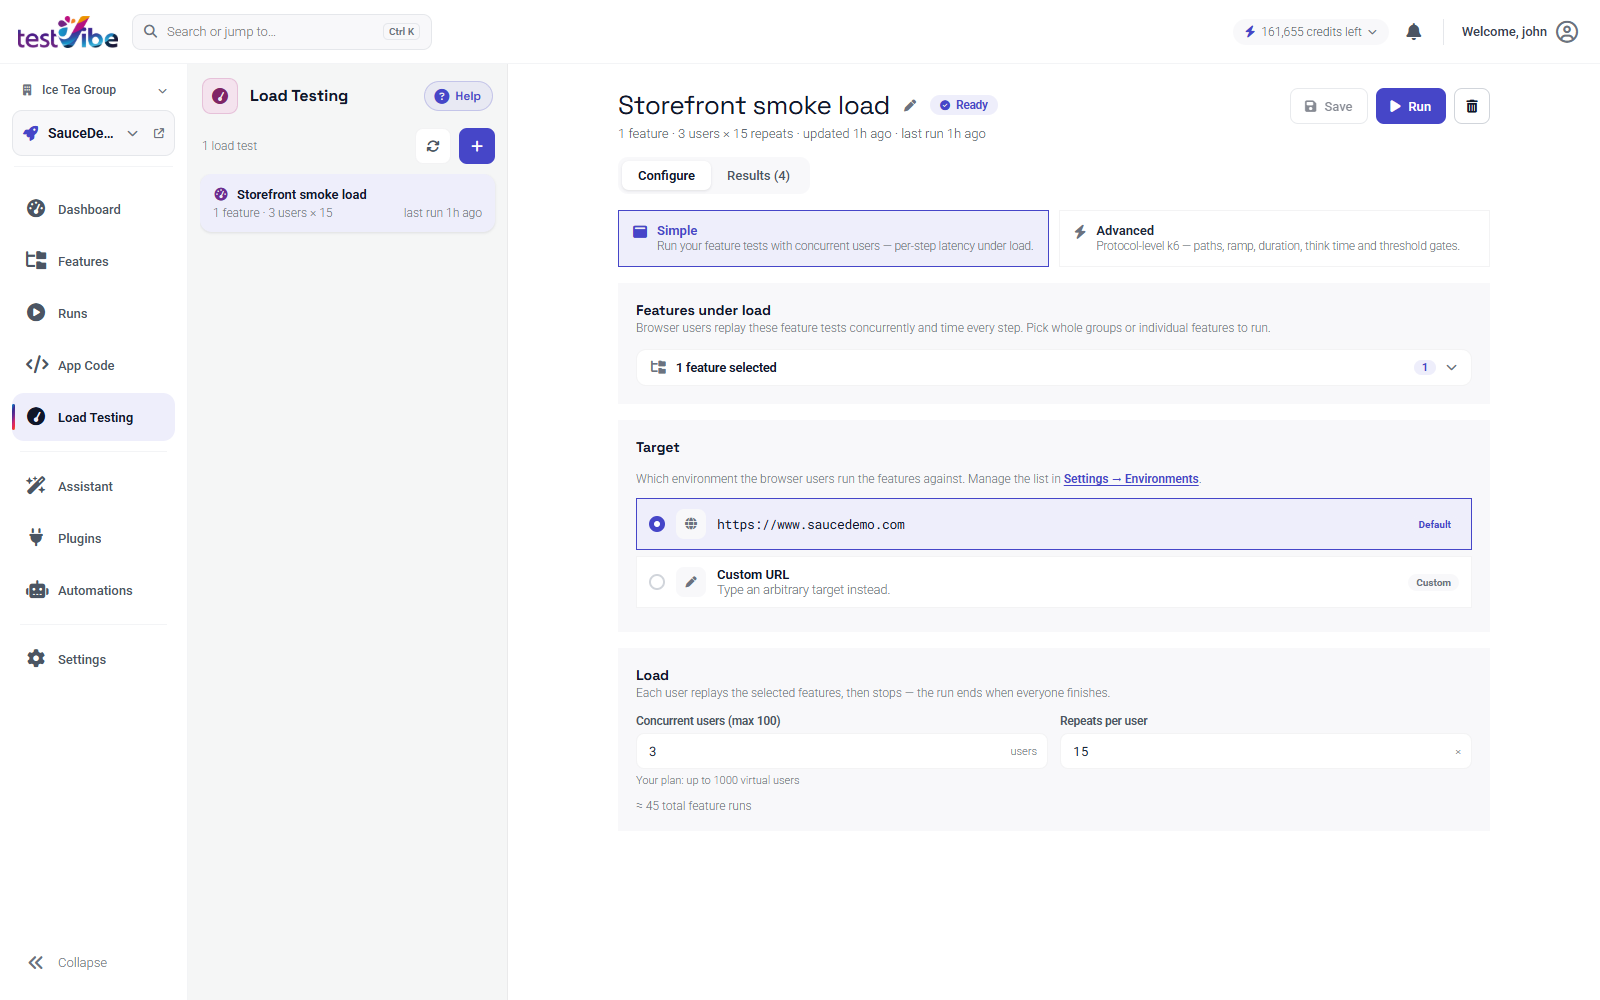
Everything happens on the load test's Configure tab. You can switch a saved test between modes at any time.
- Select Load Testing in the navigation rail.
- Select + (New load test) in the list rail.
- Pick Simple or Advanced with the toggle at the top of the form.
- Configure the mode's settings (below).
- Select Save, then Run when you're ready.
Simple mode settings
| Setting | What it controls |
|---|---|
| Features | The generated feature tests the browser users replay. Pick whole groups or individual features. |
| Users | How many browser users run concurrently, subject to plan limits and the product cap of 100. Above the configured per-machine limit (default 20), TestVibe spreads the load across multiple machines — you still see one test and one merged result. |
| Repeats per user | How many times each user replays the features. Users × repeats is the intended journey-iteration count; each iteration can contain multiple selected features, and failures or deadlines can reduce completed work. |
| Target | Which environment the users run against — pick one of the project's configured environments (the default is pre-selected) or type a Custom URL. |
Each user replays the selected features, then stops — the run ends when everyone finishes. Simple runs report per-step latency under load, so you can see which step of the journey degrades first.
Advanced mode settings
| Setting | What it controls |
|---|---|
| Target & paths | The URL the virtual users hit and the paths requested each iteration. |
| Load profile | Virtual users, total duration, ramp-up window, and think time. Users ramp from 0 to the target over the ramp-up, then hold. |
| Thresholds | k6 pass/fail gates such as p(95)<1000 on http_req_duration or rate<0.01 on http_req_failed. The run fails if any gate fails. |
| Generated k6 script | A read-only preview of the script TestVibe generated from this configuration — see exactly what will run before you start it. |
Advanced mode uses k6 threshold gates. The browser-mode runner also evaluates configured gates against journey metrics; review the saved configuration and the result’s threshold rows.
Sizing guidance
Start small — a small run can check configuration before you scale up; Simple mode also supports repeat-based work. Increase users gradually, and keep ramp-up at 10–20% of the total duration so the system warms up realistically. In Advanced mode, set thresholds from a passing baseline run rather than guessing, then tighten them once results are stable.
Running it
Select Run. The test dispatches to the cloud load fleet, the run appears on the Results tab immediately, and its charts update live while virtual users execute. Cancel stops an in-flight run; Delete removes a terminal one.
You don't have to click the button yourself, either. Load tests can be listed and dispatched from CI over the REST API, from the testvibe CLI (testvibe load run "Checkout under load" --wait makes a handy CI gate), or from AI tools via the MCP server. For a recurring schedule, create an Automation with a Run a load test action — no external scheduler needed.
Reading the results
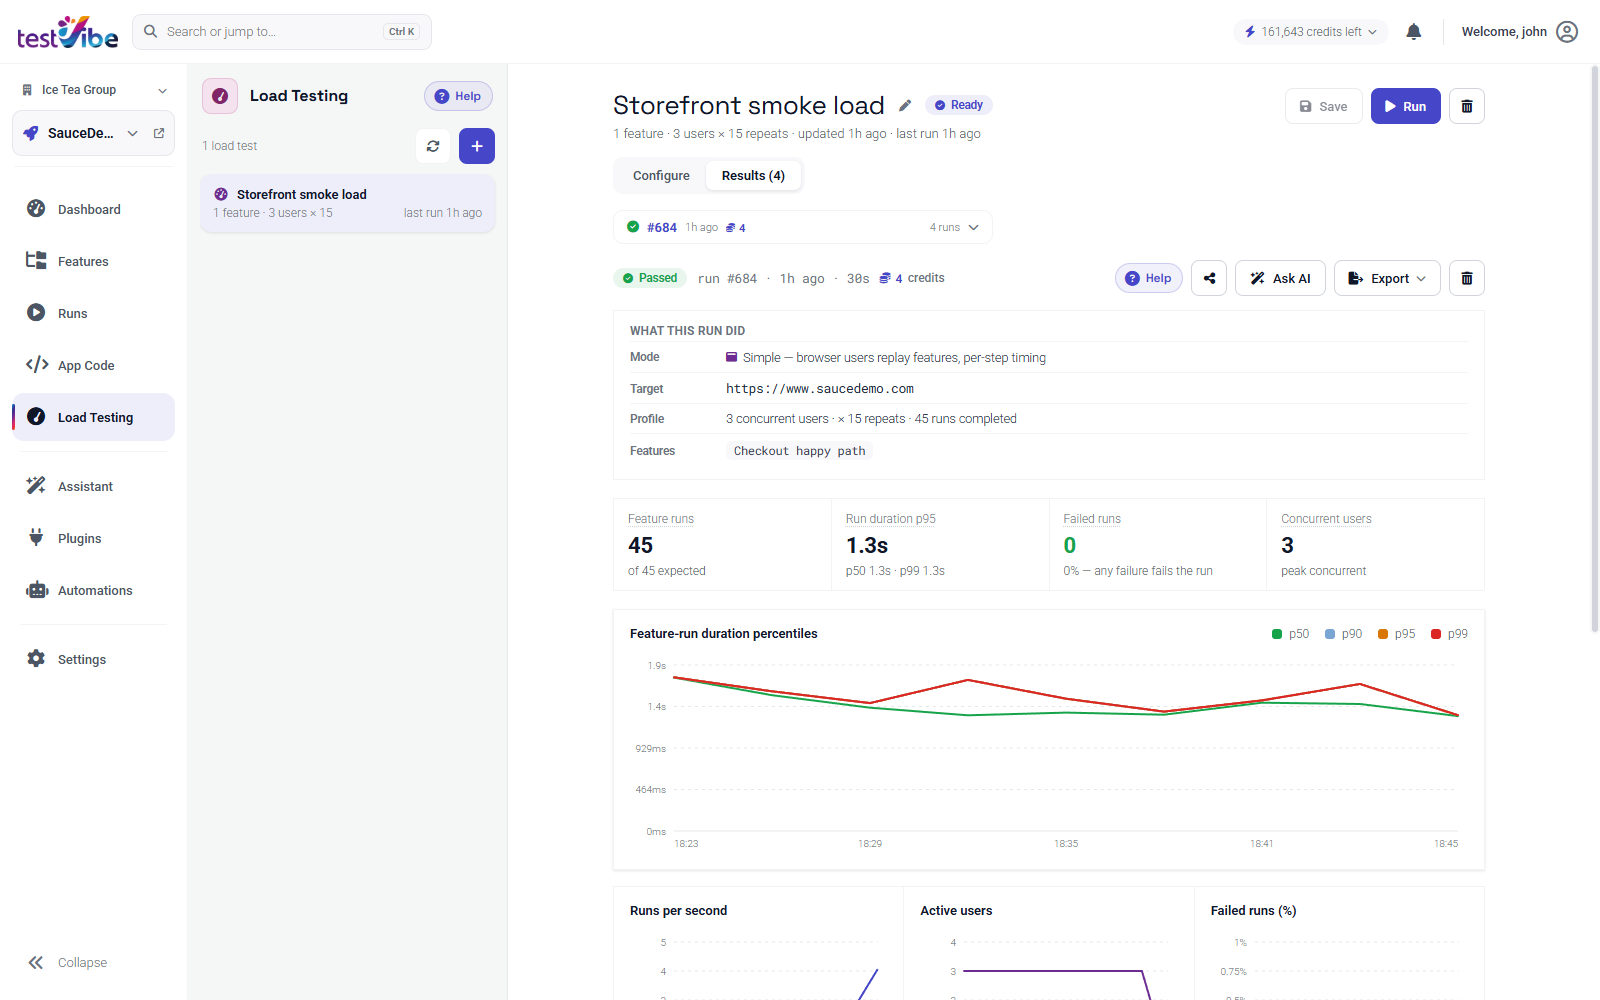
The Results tab shows a strip of past runs — select one to inspect it. Each result opens with a What this run did block: the mode, target URL, load profile, and the features exercised, so a result is never ambiguous about what produced it.
From there, read top to bottom:
- KPI tiles give the headline: total requests with peak rate, latency p95, error rate, peak concurrent users, and — for Advanced runs — the threshold gates.
- Latency percentiles chart p50/p90/p95/p99 over time. This is the chart to watch: a rising p95 under steady load is your earliest saturation signal, long before averages move.
- Throughput, users, and error rate charts confirm the load actually ramped as configured, and let you correlate error spikes with load level.
- By step — latency under load (Simple runs) breaks out per-step p50/p95/p99 and error rate, so you can see which step of the journey degrades first — usually the one hiding the slow query.
Advanced runs evaluate configured k6 aggregate thresholds. Simple runs fail when feature replays fail or a configured browser-mode threshold fails. Aggregate gates do not independently test every rolling window.
When errors are widespread or throughput is zero, inspect the target, credentials, access controls, generator health and failing steps. These symptoms do not uniquely identify a network problem. Try a functional run of the same target and identity to narrow the investigation.
When you're done reading, Ask AI seeds the Assistant with a data-rich summary of the selected run — useful for sharing a quick verdict — and Export downloads the full results as JSON, the per-step/per-endpoint table as CSV, or the raw metric samples as CSV.
Going deeper: server telemetry
Client-side numbers tell you what users experience; server telemetry adds evidence about possible bottlenecks. Install the TestVibe telemetry agent in the app you're testing (a NuGet package for .NET, a single-file agent for Node.js) and your results gain live server-side CPU, memory, optional session counts and custom metrics next to the client-side charts. CPU climbing toward saturation while p95 rises is the classic capacity ceiling; memory growing run-over-run without recovering suggests a leak the load test is exposing.
Wrap-up
Load testing in TestVibe is deliberately boring to operate: pick the journeys you already have (or the endpoints you care about), set users and duration, press Run, and read the charts. The heavy lifting — script generation, fleet dispatch, sharding across machines, merging results — is handled for you.
Want to try it on your own app? TestVibe is in early access — get early access and start with a small workload appropriate to the selected mode. The load-testing docs cover every setting in detail.