A load test can pass its average-latency target while a small set of requests waits several seconds. Read p95 and p99 alongside throughput and errors to see that slow tail. The example below shows why one average is not enough.
How the average hides slow requests
Say you run a checkout journey with 200 requests and record these latencies. Exactly 190 take 300 ms and ten take 4 seconds because a connection pool is saturated. The math:
mean          = 485 ms
p50 (median)  = 300 ms
p95           = 300 ms  // nearest-rank: sample 190 of 200
p99           = 4000 ms // nearest-rank: sample 198 of 200
The average tells you 485 ms and everyone nods. Here 5% of requests take 4 seconds. Different percentile estimators can interpolate differently; request counts do not identify distinct users. A single mean can't show you that tail because the fast requests drown it out.
p95 = 900 ms means the estimated 95th-percentile request duration is 900 ms. Under a nearest-rank convention, at least 95% of measured requests finish in 900 ms or less. You can set a percentile target in an SLO and gate a test on it, but an observed result describes the measured workload; it does not promise future performance.
Rules of thumb worth internalizing:
- p50 is the median request duration. If it is high, at least half the measured requests are at that duration or slower.
- p95 can be an SLO target. Choose the percentile and threshold for the operation, sample size, and user requirement.
- p99 describes the slower tail. It can help investigate lock contention, GC pauses, cold caches, and connection-pool exhaustion — the stuff that only shows up under load.
- Never average percentiles across runs or endpoints. A p95 of two p95s is meaningless; you have to recompute from the raw samples.
Ramp, don't slam
How you apply load matters as much as how much. Dumping 500 virtual users on a cold system in one second measures your cold-start behavior, not your steady-state capacity. Both are worth knowing, but don't confuse them.
A realistic profile ramps virtual users from zero to the target over a warm-up window, then holds:
// k6 stages: ramp to 100 VUs, hold, ramp down
export const options = {
  stages: [
    { duration: '2m', target: 100 },  // ramp-up: 0 → 100 VUs
    { duration: '10m', target: 100 }, // steady state: hold 100 VUs
    { duration: '1m', target: 0 },    // ramp-down
  ],
};
An illustrative starting point is a ramp of roughly 10–20% of the total duration so connection pools, JITs, and caches warm the way they would in production. Then read the hold phase for your capacity numbers — the ramp phase is noise for that question. A common mistake is reading the peak-latency spike during ramp-up and declaring the system broken, when it just needed thirty seconds to warm up.
Watch two curves together: active users and throughput. If VUs climb but requests-per-second flatlines, you've found your ceiling — adding load isn't producing more work, it's just producing more waiting.
Spend an error budget, don't blow it
Choose an error target appropriate to the operation; zero errors may be necessary for some workflows. At the edge of capacity, a tiny, bounded error rate is acceptable — that's what an error budget is for. Pick a threshold and hold the run to it:
export const options = {
  thresholds: {
    http_req_failed: ['rate<0.01'],    // require less than 1% failures
    http_req_duration: ['p(95)<1000'], // 95% under 1 second
  },
};
A k6 run passes its thresholds if all configured aggregate checks pass. These default thresholds do not independently gate every 90-second window. Add suitable scoped measurements or explicit window analysis when a brief outage must fail the run.
When errors do appear, correlate them with the load curve. Errors that start exactly when VUs cross a certain number point at a hard limit — a connection pool, a rate limiter, a thread cap. Errors scattered randomly at low load point at something flaky in the app itself. The shape suggests hypotheses; correlate it with logs and resource measurements.
Spotting saturation before it spots you
Saturation is when the system runs out of some resource and latency starts climbing while throughput stops. The earliest, cleanest signal is a rising p95 under steady load. If your VU count is flat but p95 drifts upward over the hold phase, something is filling up — a queue, a pool, memory, disk. You're watching a leak or a backlog form in real time.
The classic saturation signature, all at once:
- p50 stays roughly flat (typical users still fine)
- p95 and p99 fan out and climb (the tail is stretching)
- throughput plateaus even as you add VUs
- error rate starts ticking up at the end
When you see the percentile lines diverge like that, you've found your knee — the load level where the system stops scaling linearly. That number is your real capacity, and you want a comfortable margin below it in production.
Where TestVibe fits
TestVibe's load testing gives you exactly these views without wiring up your own tooling. Simple mode runs concurrent browser users that replay your generated feature tests and time every step, so you get per-step p50/p95/p99 and can see which step of the journey degrades first. Advanced mode generates a protocol-level k6 script with virtual users, a ramp-up window, and threshold gates like p(95)<1000 or rate<0.01 — the run fails if a configured aggregate gate fails.
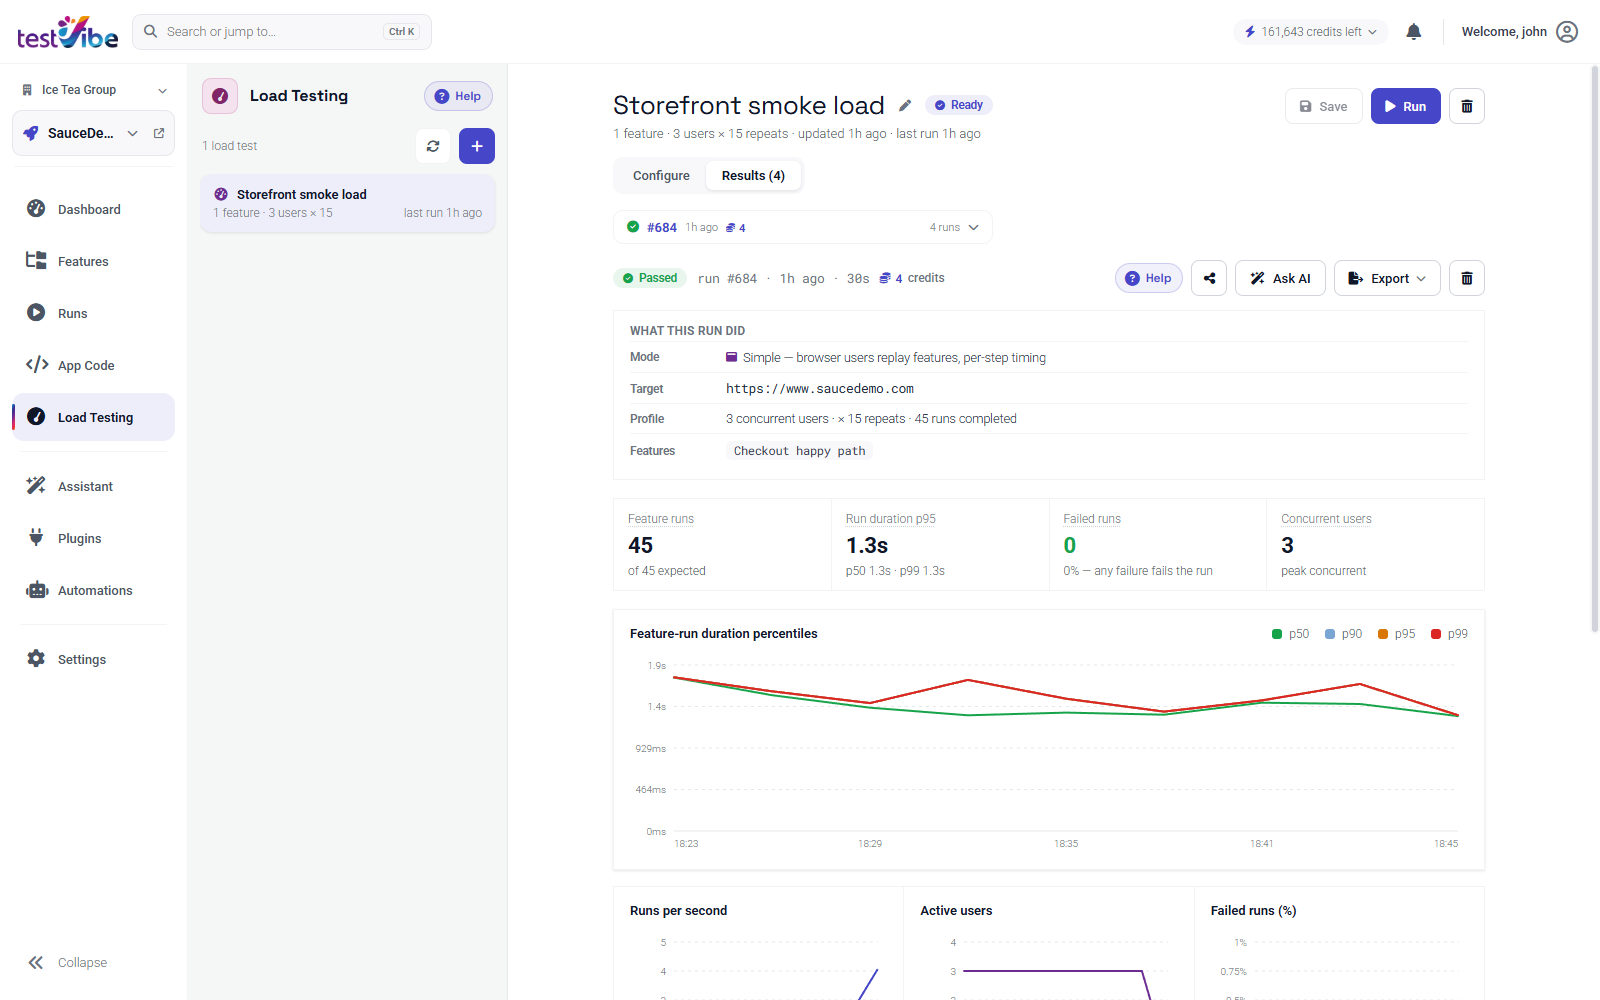
The results view puts the percentile-over-time chart, the throughput and active-users curves, and the error rate side by side — which is precisely the correlation you need to tell warm-up from saturation. Set your thresholds from a passing baseline run rather than guessing, then tighten them as results stabilize.
Read percentiles alongside the average, separate warm-up from the hold phase, and gate on thresholds tied to your requirements. Save the workload and baseline so the next run is comparable. Get early access to try it, or read Run a load test and read results for the full walkthrough.