A protocol virtual user (VU) sends HTTP requests. A browser VU drives headless Chromium, renders pages, and runs your JavaScript. Choose protocol VUs to investigate backend capacity and browser VUs to measure a journey under load. This guide explains the trade-off and how to combine them.
Two clients, two questions
k6 gives you both. A protocol VU issues HTTP requests directly — no DOM, no CSS, no client-side JS. It asks: can my server take the request rate? A browser VU, powered by the k6 browser module, launches a real Chromium instance per user, navigates, clicks, and waits for elements. It asks: does the whole experience hold up — server plus rendering plus front-end JavaScript — under concurrency?
That distinction drives everything else:
| Protocol VU | Browser VU | |
|---|---|---|
| What runs | HTTP requests | A real headless browser |
| Measures | Backend throughput, request latency | End-to-end page/journey latency, front-end behavior |
| Sees client-side JS | No | Yes |
| Resources per VU | HTTP client; workload-dependent | Browser execution; usually more CPU/memory |
| Practical concurrency | Measure on your load generator | Measure on your load generator |
| Best for | API and endpoint capacity | User-perceived performance |
Neither is "better." They answer different questions, and a serious load campaign usually needs both.
Protocol VUs: throughput at scale
When the thing you're worried about is your API tier, your database connection pool, or a specific endpoint under a traffic spike, protocol VUs are the right instrument. They're cheap enough to simulate the concurrency numbers that actually stress a backend, and they isolate server latency from everything the browser adds on top.
A protocol scenario in k6 looks like this:
import http from 'k6/http';
import { check, sleep } from 'k6';

export const options = {
  stages: [
    { duration: '30s', target: 200 }, // ramp up to 200 VUs
    { duration: '2m',  target: 200 }, // hold at peak
    { duration: '30s', target: 0 },   // ramp down
  ],
  thresholds: {
    http_req_duration: ['p(95)<1000'], // 95% of requests under 1s
    http_req_failed:   ['rate<0.01'],  // under 1% errors
  },
};

export default function () {
  const res = http.get('https://example.com/api/products');
  check(res, { 'status is 200': (r) => r.status === 200 });
  sleep(1); // think time between iterations
}
Two things earn their place here. The stages block ramps load in instead of slamming the server cold — real traffic warms caches and connection pools, and so should your test. The thresholds block turns the run into a pass/fail gate: exceed the p95 latency budget or the error-rate budget and the whole run fails, which is exactly what you want wiring this into CI.
Browser VUs: what the user actually feels
Protocol numbers can look pristine while real users suffer. Your API returns in 80 ms, but the page still takes four seconds because a client-side bundle blocks rendering, or a third-party widget stalls, or the app fires a waterfall of XHRs your protocol script never modeled. Browser VUs can expose these effects when the scripted journey and measurements exercise them; they do not represent every real user or automatically measure field INP.
import { browser } from 'k6/browser';
import { check } from 'k6';

export const options = {
  scenarios: {
    ui: {
      executor: 'constant-vus',
      vus: 10,
      duration: '2m',
      options: { browser: { type: 'chromium' } },
    },
  },
};

export default async function () {
  const page = await browser.newPage();
  try {
    await page.goto('https://example.com');
    await page.locator('#login-button').click();
    const catalogVisible = await page.locator('.inventory_list').isVisible();
    check(catalogVisible, { 'catalog rendered': (visible) => visible });
  } finally {
    await page.close();
  }
}
Note the VU count: ten, not two hundred. Each browser VU is a full Chromium process consuming real CPU and memory, so you run far fewer of them. That's the fidelity/cost trade in one line — you're paying for realism, and it's expensive enough that you use it deliberately.
The trade-off, stated plainly
Fidelity and cost move together. Protocol VUs are cheap and let you reach the concurrency that breaks a backend, but they're blind to everything the browser does. Browser VUs see the real experience but usually require more generator resources; measure the practical concurrency and cost for your workload.
The practical answer is to layer them. Use protocol VUs to generate the background load — the thousands of concurrent requests that push your infrastructure toward its ceiling — and a smaller pool of browser VUs to measure user-perceived latency while that pressure is on. The protocol traffic creates the stress; the browser traffic tells you whether a real person would notice.
Designing the scenario, not just the load
A load number without a shape is noise. Three parameters turn "200 users" into a test that means something:
- Ramp-up. Bring VUs from zero to peak over a window — a good default is 10–20% of the total duration — so the system warms realistically instead of facing a thundering-herd cold start.
- Think time. Real users pause between actions. A
sleep()between iterations keeps your synthetic load from being unrealistically machine-gun-fast and inflating request rates that no human would produce. - Thresholds from a baseline. Don't guess your gates. Run a passing load first, read the actual p95 and error rate, then set thresholds just above them. Tighten as results stabilize. A threshold pulled from thin air either never fails or always does.
Start small regardless of mode: ten users for sixty seconds is enough to prove the scenario is wired correctly end to end before you scale the numbers up.
Where TestVibe fits
If you'd rather not hand-author k6, TestVibe's load testing maps directly onto this same split. Simple mode spins up concurrent browser users that replay your generated feature tests and times every step — browser-VU fidelity, no script to write, with per-step latency so you see which step of a journey degrades first. Advanced mode is protocol-level k6 with a load profile (virtual users, ramp, duration, think time) and threshold gates; TestVibe generates the k6 script and shows it to you read-only before the run. You pick the mode per test and switch it whenever the question changes.
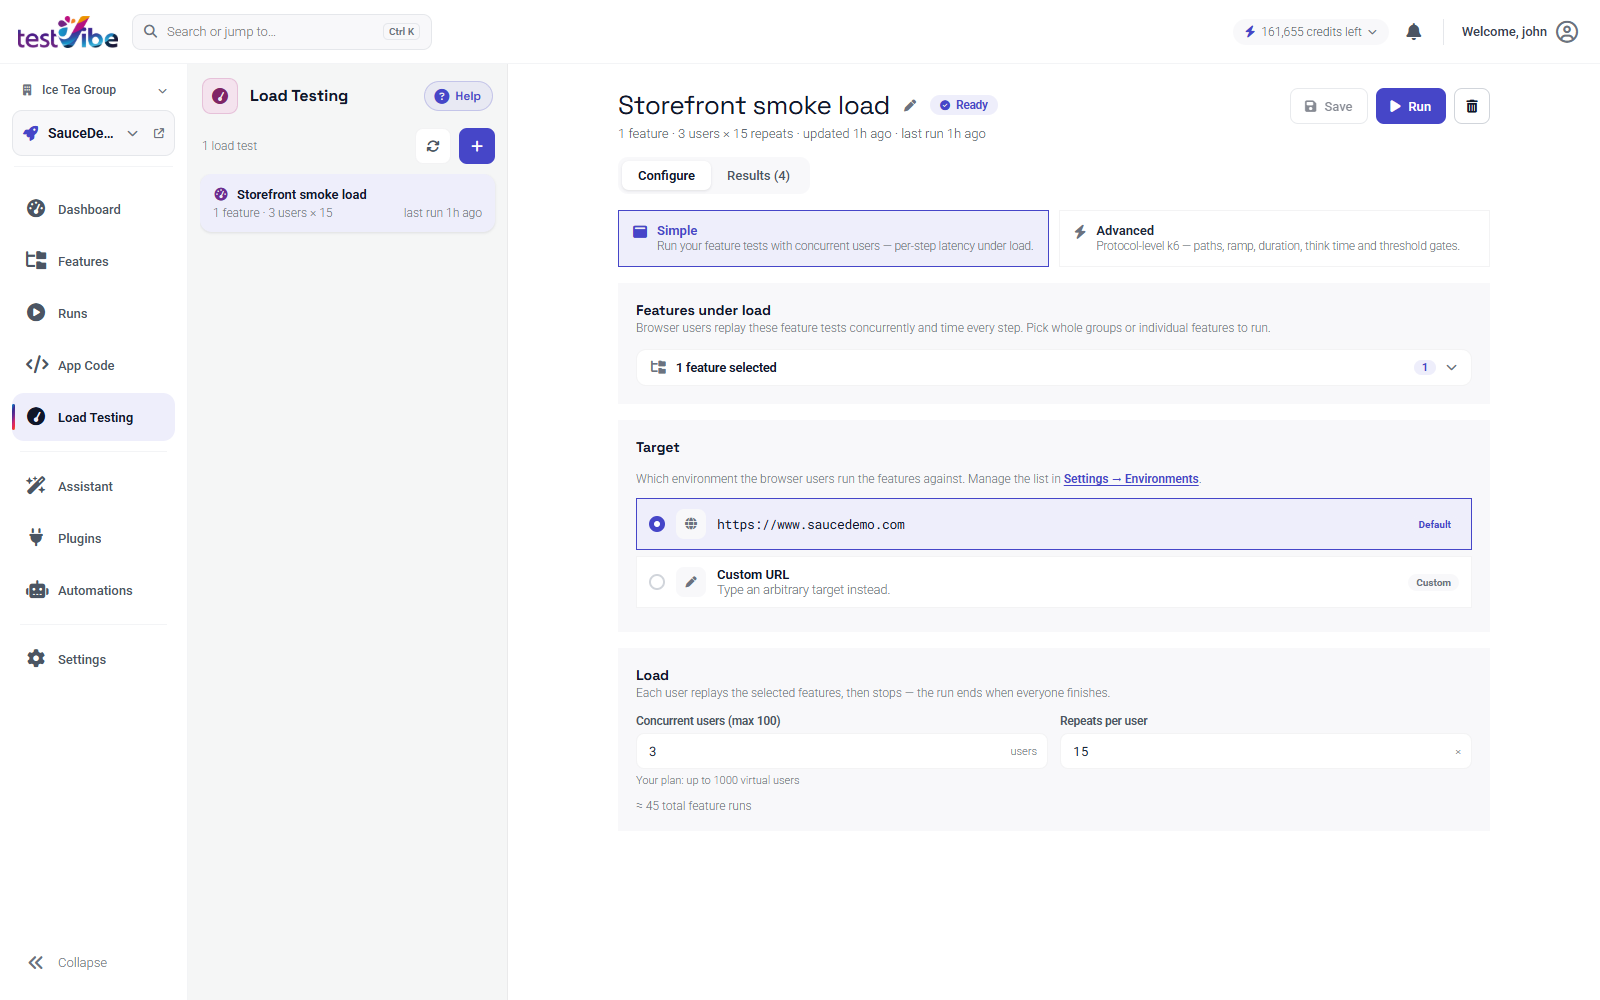
Either way the run dispatches to a cloud fleet and charts latency percentiles, throughput, active users, and error rate live. A rising p95 under steady load is your earliest saturation signal; a 100% error rate can result from reachability, authentication, test configuration or an app failure. Inspect errors before assigning the cause.
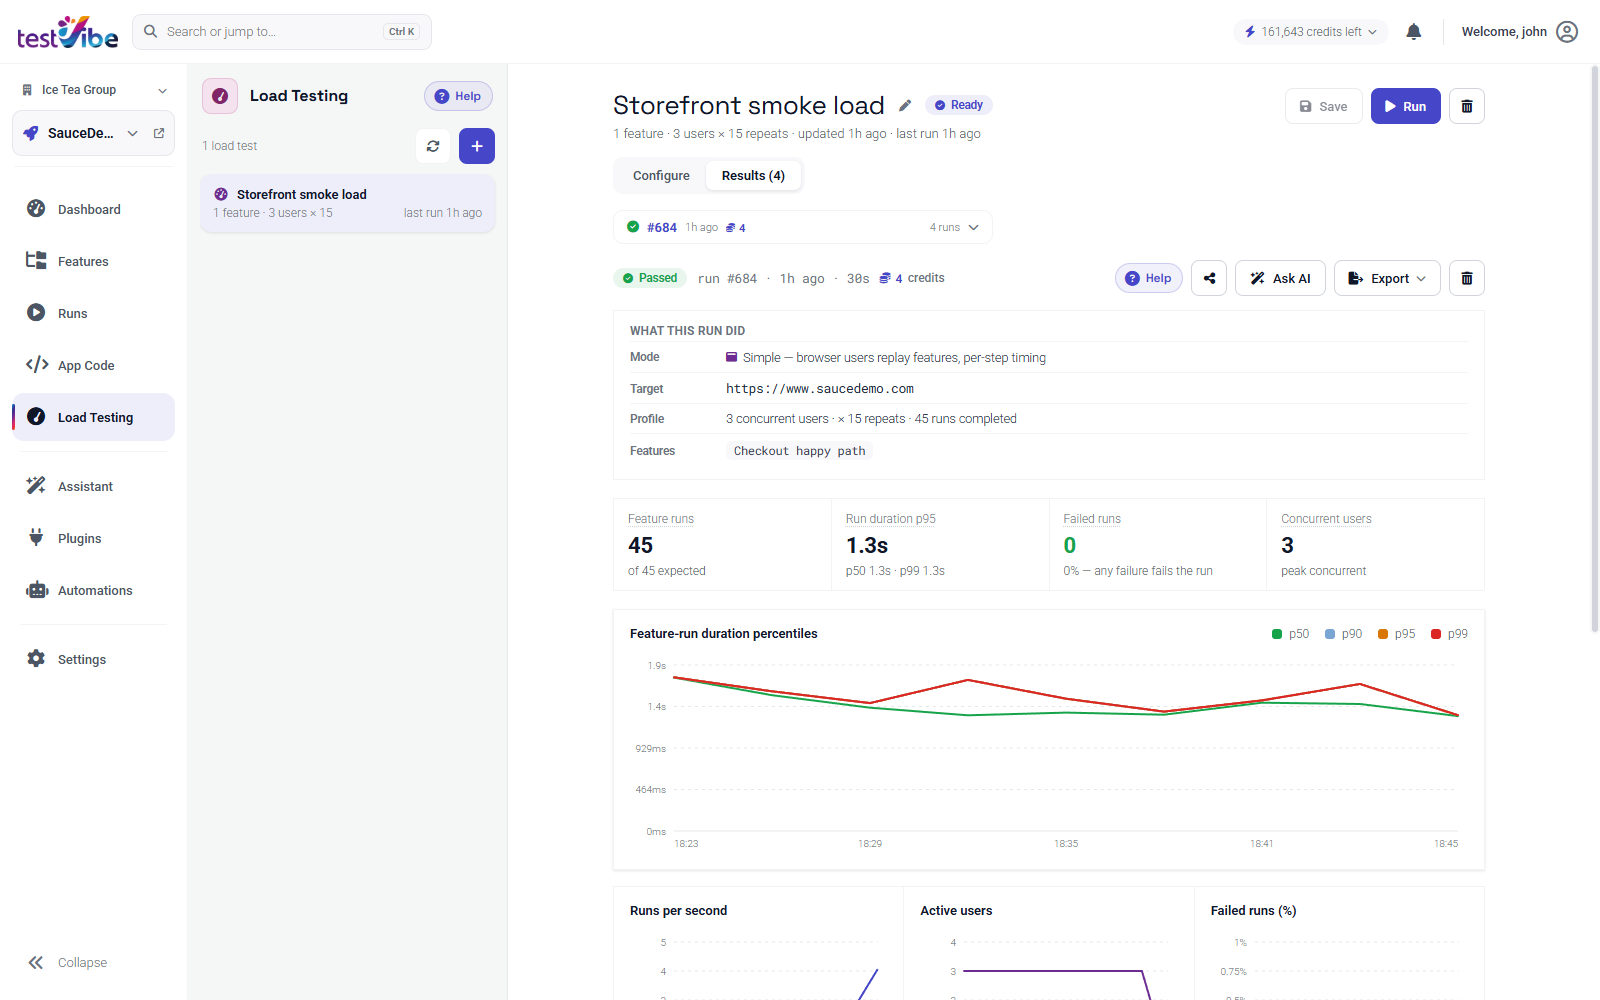
For the protocol side, thresholds do the gating: a failing threshold marks the run failed even if requests returned responses. Immediate cancellation requires an explicit abort policy. That makes it a clean CI check — dispatch it and wait for the verdict:
testvibe load run "Checkout under load" --waitChoosing, in one line
Reach for protocol VUs when the question is how much can my backend take, and browser VUs when it's what will my users actually feel. Design the scenario — ramp, think time, thresholds from a real baseline — before you scale the numbers, and layer the two when you need both answers at once. Want to try the browser-VU-versus-protocol split without writing k6 by hand? Get early access, or read the load testing docs first.