Every run leaves evidence behind. When a test fails, the fastest path to a fix is usually a screenshot of the broken page, a video of the sequence that got there, or a Playwright trace of every action. This guide covers what TestVibe captures, where each artifact lives, how to download it, and how the shared storage quota keeps it all from growing without limit.
What counts as an artifact
An artifact is any file a run produces: screenshots, videos, Playwright traces, logs, and exported reports. TestVibe uploads them as the run executes and attaches each one to the scenario that produced it, so you never match cryptic filenames by hand.
Open Runs, select a run, and the run detail view organizes everything into tabs:
| Tab | What it holds |
|---|---|
| Features | Scenario rows, grouped, with pass/fail status and per-row details. |
| Images | Screenshots captured across the run. |
| Videos | Video recordings of the browser session, with the associated test label. |
| Artifacts | Every file the run uploaded — screenshots, video, traces, logs — each individually downloadable and grouped by scenario. |
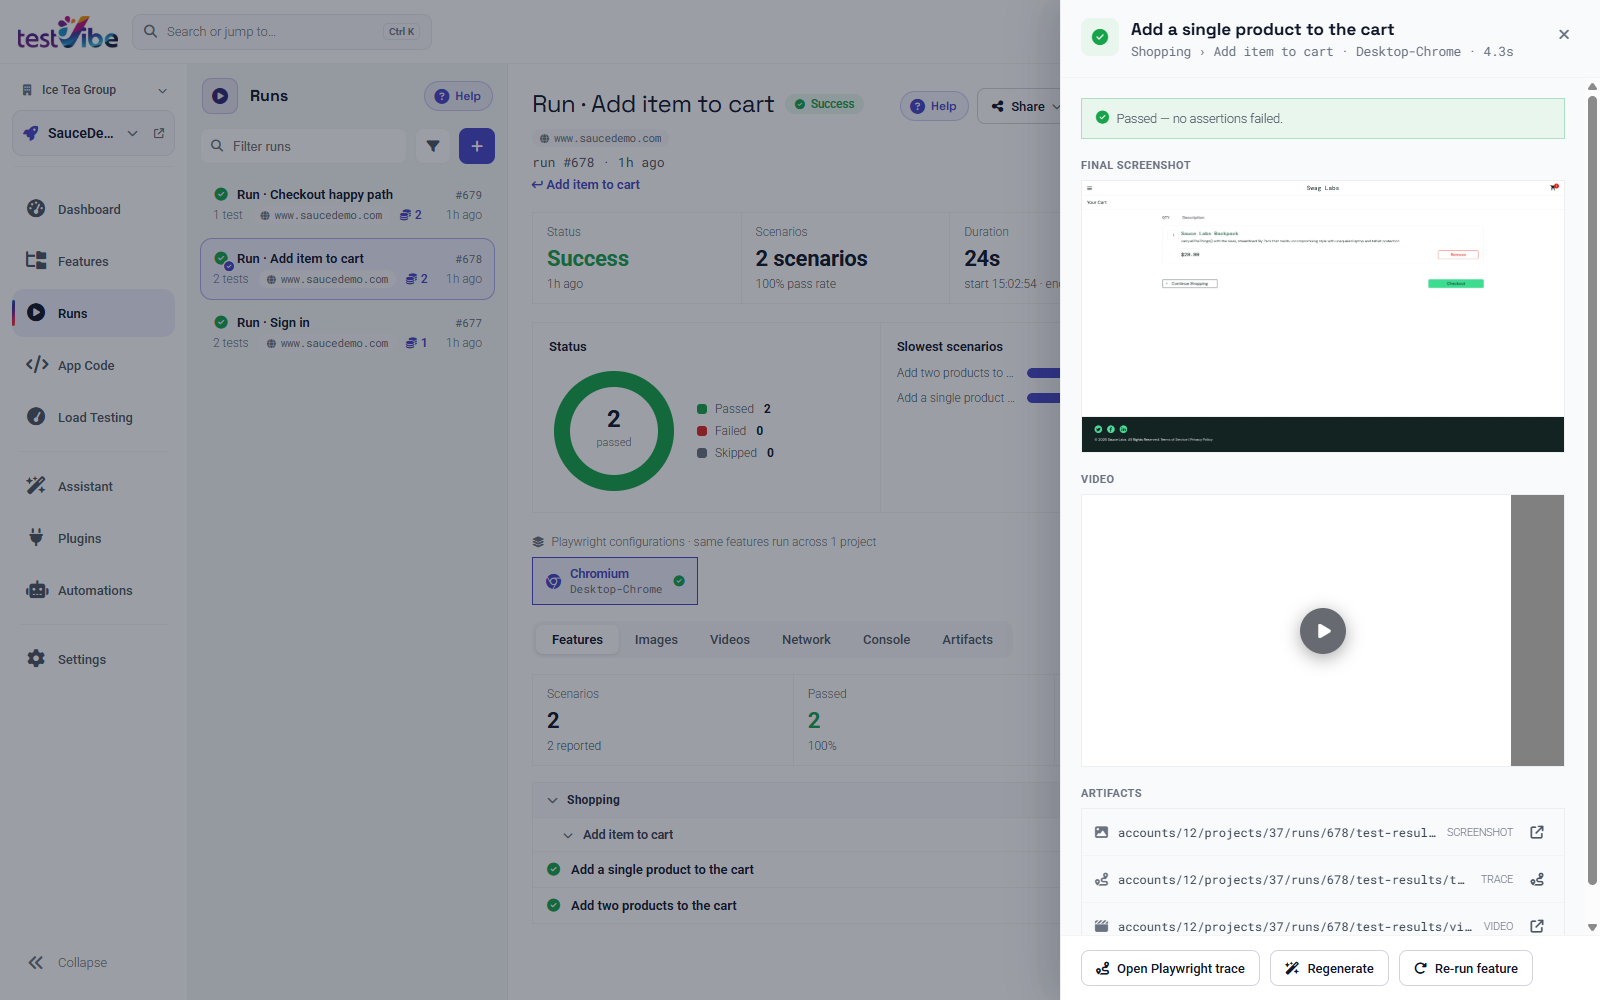
Open a scenario row and its evidence sits together: the final screenshot, the video, and a list of raw artifact files with a Screenshot, Video, or Trace tag on each.
Screenshots and videos
Screenshots answer "what did the browser look like at this moment?" You'll find them in two places: matched to a specific failed test in the row details, and browsable for the whole run in the Images tab. Click any image to open a larger preview, then download it to attach to a bug report.
Videos answer the sequence question that a static screenshot can't. The Videos tab lists a row per recording with the test label and, when available, the file size. Watch it to confirm whether navigation happened, whether the page finished loading, or whether a modal blocked a click before the failing step.
Traces: the deep debugger
A Playwright trace is the richest artifact TestVibe keeps. It records actions, DOM snapshots, console events, network requests, timing, and screenshots — enough to replay the run event by event.
Open a scenario in the Features tab, then:
- For a failed scenario, choose Debug with AI. This opens the trace in the Playwright trace viewer and docks an AI assistant beside it that starts diagnosing the failure automatically.
- For a passed or skipped scenario, choose Open Playwright trace to open the same viewer without the assistant.
If a scenario captured no trace, that action simply isn't shown for the row. To keep a copy outside TestVibe, download the raw .zip trace from the Artifacts tab.
Availability depends on the run configuration
Artifacts aren't captured unconditionally; the run configuration decides. This mirrors Playwright's own capture modes, which trade evidence coverage against artifact size:
// The underlying Playwright options a run configuration maps to
export default defineConfig({
  use: {
    screenshot: 'only-on-failure',   // 'on' | 'off' | 'only-on-failure'
    video: 'retain-on-failure',      // 'on' | 'off' | 'retain-on-failure'
    trace: 'retain-on-failure',      // or 'on-first-retry' when retries are configured
  },
});
A practical option is to keep traces and video on failure only — full evidence when something breaks, less retained evidence from passing runs. That's why a green run may have nothing in its Videos tab, and it's the first thing to check when evidence is missing. Artifacts can also be absent because the run is still finalizing, because the run failed before Playwright launched, or because the files have since expired.
Exporting a whole run
Beyond individual files, the run detail Download menu exports the run itself for sharing outside TestVibe — as JSON, CSV, an Excel workbook, a PDF report, or a PNG snapshot:
| Export | Use it for |
|---|---|
| Results (JSON) | A machine-readable copy of the run, scenarios, and artifact links. |
| Scenarios (CSV) | A spreadsheet of each scenario's status, duration, and error. |
| Excel workbook | A summary plus scenario and artifact sheets in one file. |
| PDF / PNG | A shareable snapshot of the run detail for a chat or ticket. |
The JSON export carries links back to the artifacts, so a downstream tool can pull the exact screenshot or trace it needs.
The storage quota
All of this evidence lives against one shared storage quota per workspace — a byte allowance set by your plan, not something that draws from your credit balance. Runs and traces share the same pool as telemetry, load results, features, generated tests, assistant chat, assets, and notes.
| Plan | Included storage |
|---|---|
| Free | 1 GB |
| Personal | 10 GB |
| Team | 100 GB |
| Business | 500 GB |
| Enterprise | Contracted quota (1 TB reference allowance) |
Manage it in Settings → Storage, which shows total used versus the quota, a breakdown by data type, and a collapsible By project view so you can see which project is hoarding traces. The Dashboard's Usage panel carries the same live meter.
Two controls keep it under the line: per-type retention, set on the same panel, decides how long TestVibe keeps each data type before auto-managed cleanup removes the oldest entries as you approach the quota; and a Clear action, scoped to each project, frees space on demand without waiting for that cleanup.
When you hit the ceiling
Going over quota blocks new work rather than interrupting what's running. New run, generation, and load-test dispatches, asset uploads, and visual-regression baseline writes are gated with a Storage full message; quota enforcement does not promise that in-flight work will succeed. Reviewing and deleting available data remain the way to free capacity. Because deleting frees space immediately, clearing an old run or two is faster than waiting for scheduled cleanup.
Artifacts are only useful if you can find them and afford to keep them — TestVibe groups them by scenario and gives you retention knobs so both stay true. Get early access to try it, or read the Storage docs for the full breakdown.